Efficiency Study on Mercedes AMG F1 Engine
Tools: Microsoft Excel, GT Power
Project Overview
This project focused on how the Mercedes‑AMG Petronas Formula One Team is able to achieve 50% thermal efficiency with the given FIA Engine Regulation from the Turbo Hybrid Era. Using a combination of analytical calculations and engine simulation, the study examined how the ignition timing and speed of heat released from fuel affects the cylinder pressure and mechanical efficiency of the engine. The goal was to better understand how modern technologies like pre-chamber combustion and turbochargers are able to increase efficiency given engine parameters
Engine Parameters and Assumptions
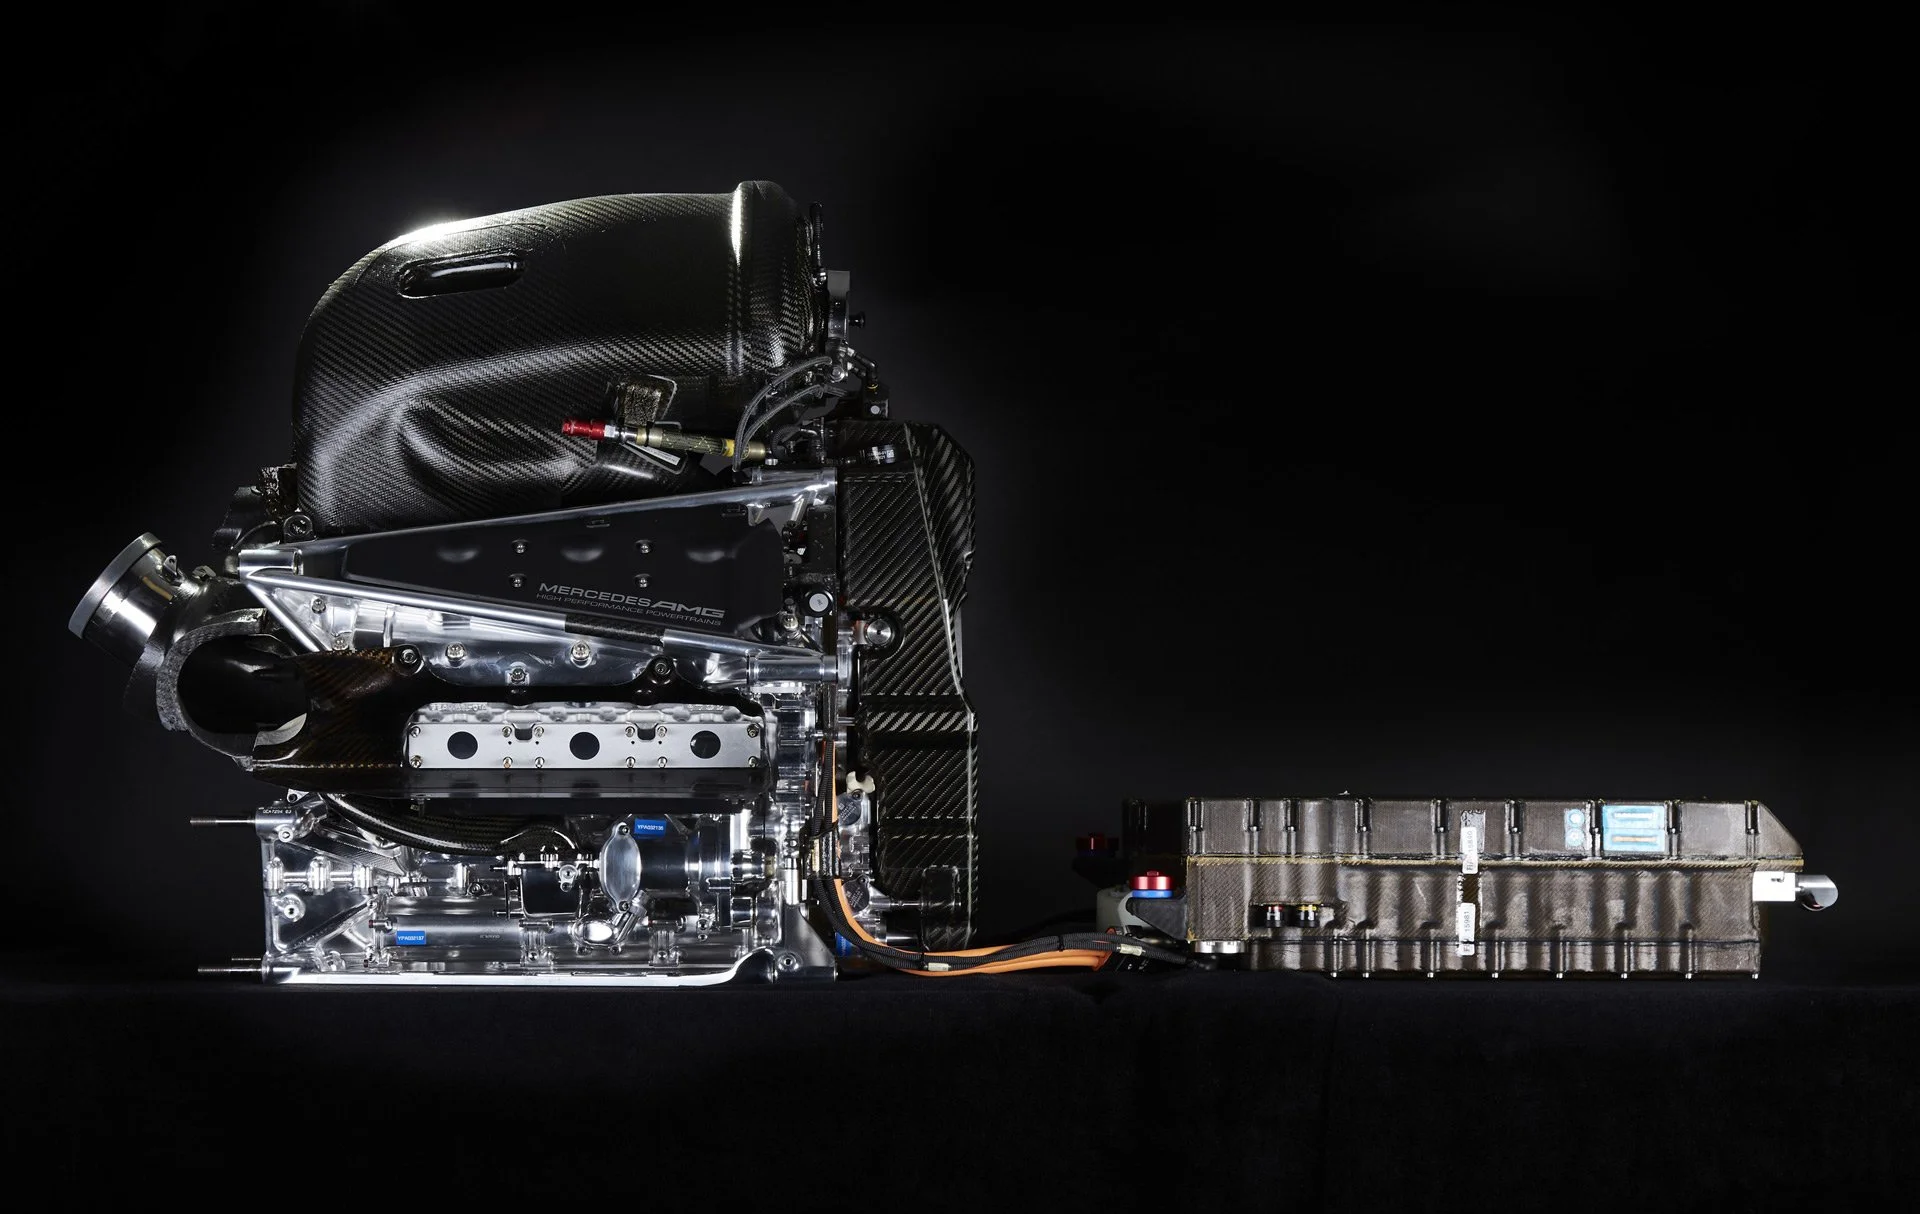
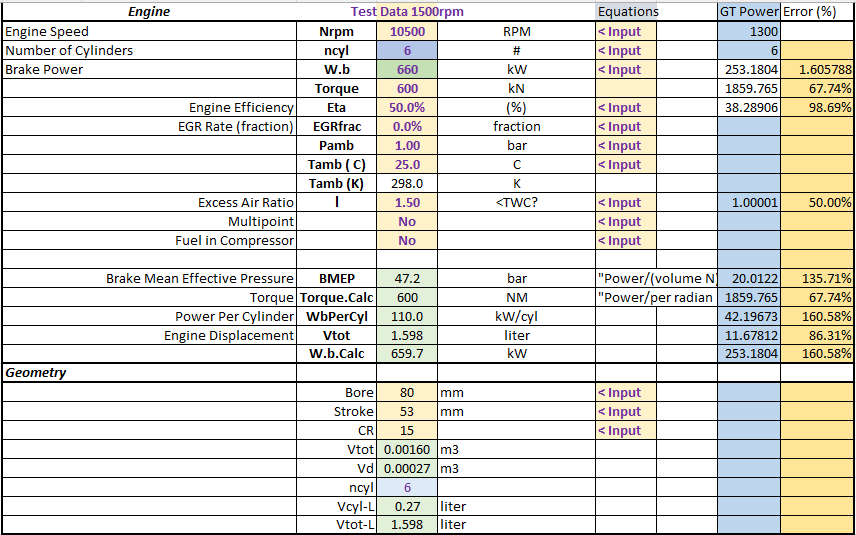
Engine parameters for this study were defined using publicly available FIA Formula One World Championship power unit regulations and technical information representative of the Mercedes-AMG Petronas Formula One Team W07-era power unit. Regulatory limits were used to establish the core engine architecture, while performance values were selected to reflect typical hybrid-era Formula 1 operating conditions.
The power unit was modeled as a 1.6-liter turbocharged V6 with six cylinders, constrained by FIA regulations on displacement, bore and stroke geometry, and compression ratio. The engine was assumed to operate near the regulatory maximum speed of 15,000 RPM, using unleaded racing gasoline as specified by FIA fuel regulations. Fuel flow limits and compression ratio constraints were applied to bound achievable power and efficiency.
Representative values for power output (≈900–1000 hp combined ICE and hybrid contribution) and operating conditions were selected based on published technical references and regulatory limits, rather than proprietary team data. These parameters were used to provide a realistic baseline for evaluating efficiency trends rather than predicting exact engine performance.
All calculations and the full efficiency study were completed in Microsoft Excel, including the parameter setup, energy balance, and efficiency breakdowns. GT-Power was used to cross-reference key trends and validate that the Excel-based analysis produced realistic behavior under comparable conditions.
RFD Tool Set Up
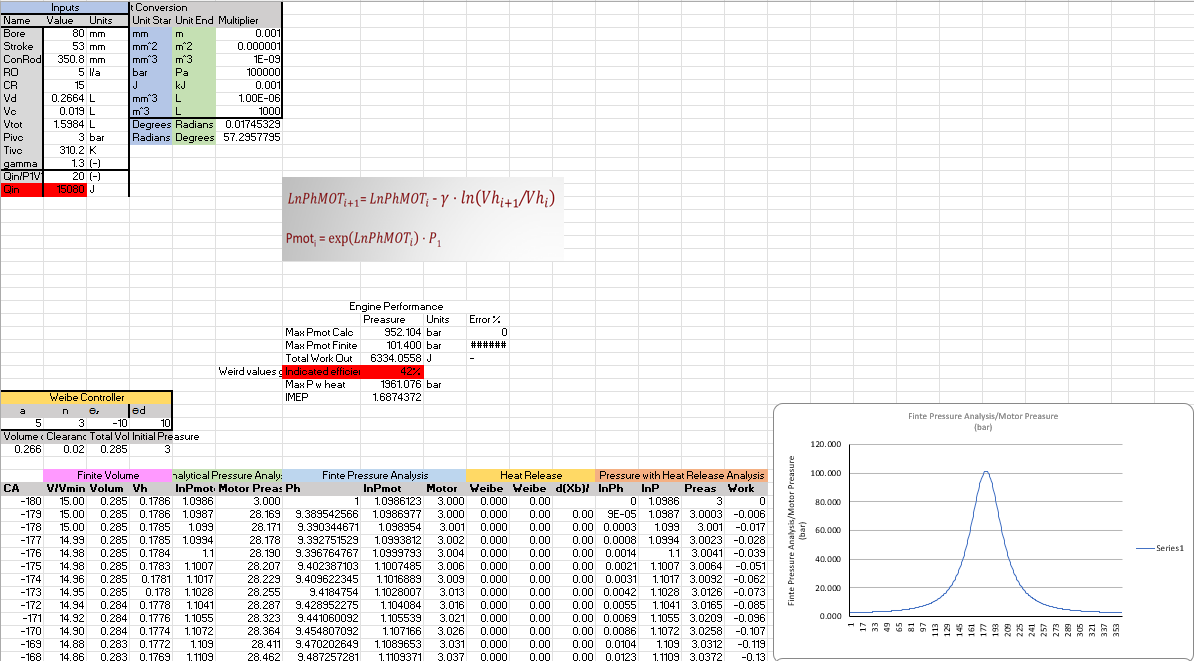
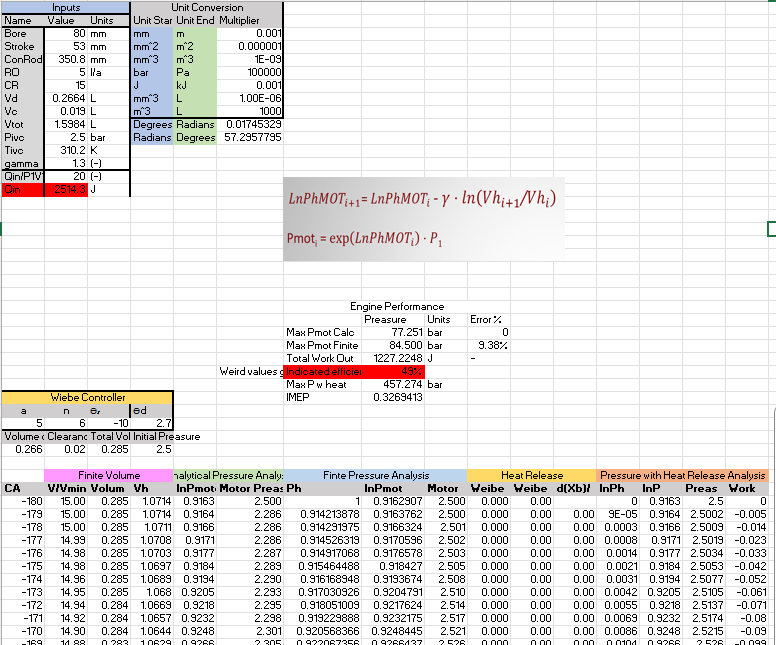
We took this information and began building a Rate of Force Development (RFD) table built in Excel. The engine inputs would be used in serval sheets to calculate certain requirements for combustion like amount of fuel injected per cycle and required air needed for stoichiometric combustion. All of these variables are brought together to build a table of engine pressure during the combustion cycle in order to calculate thermodynamic efficiency of the engine.
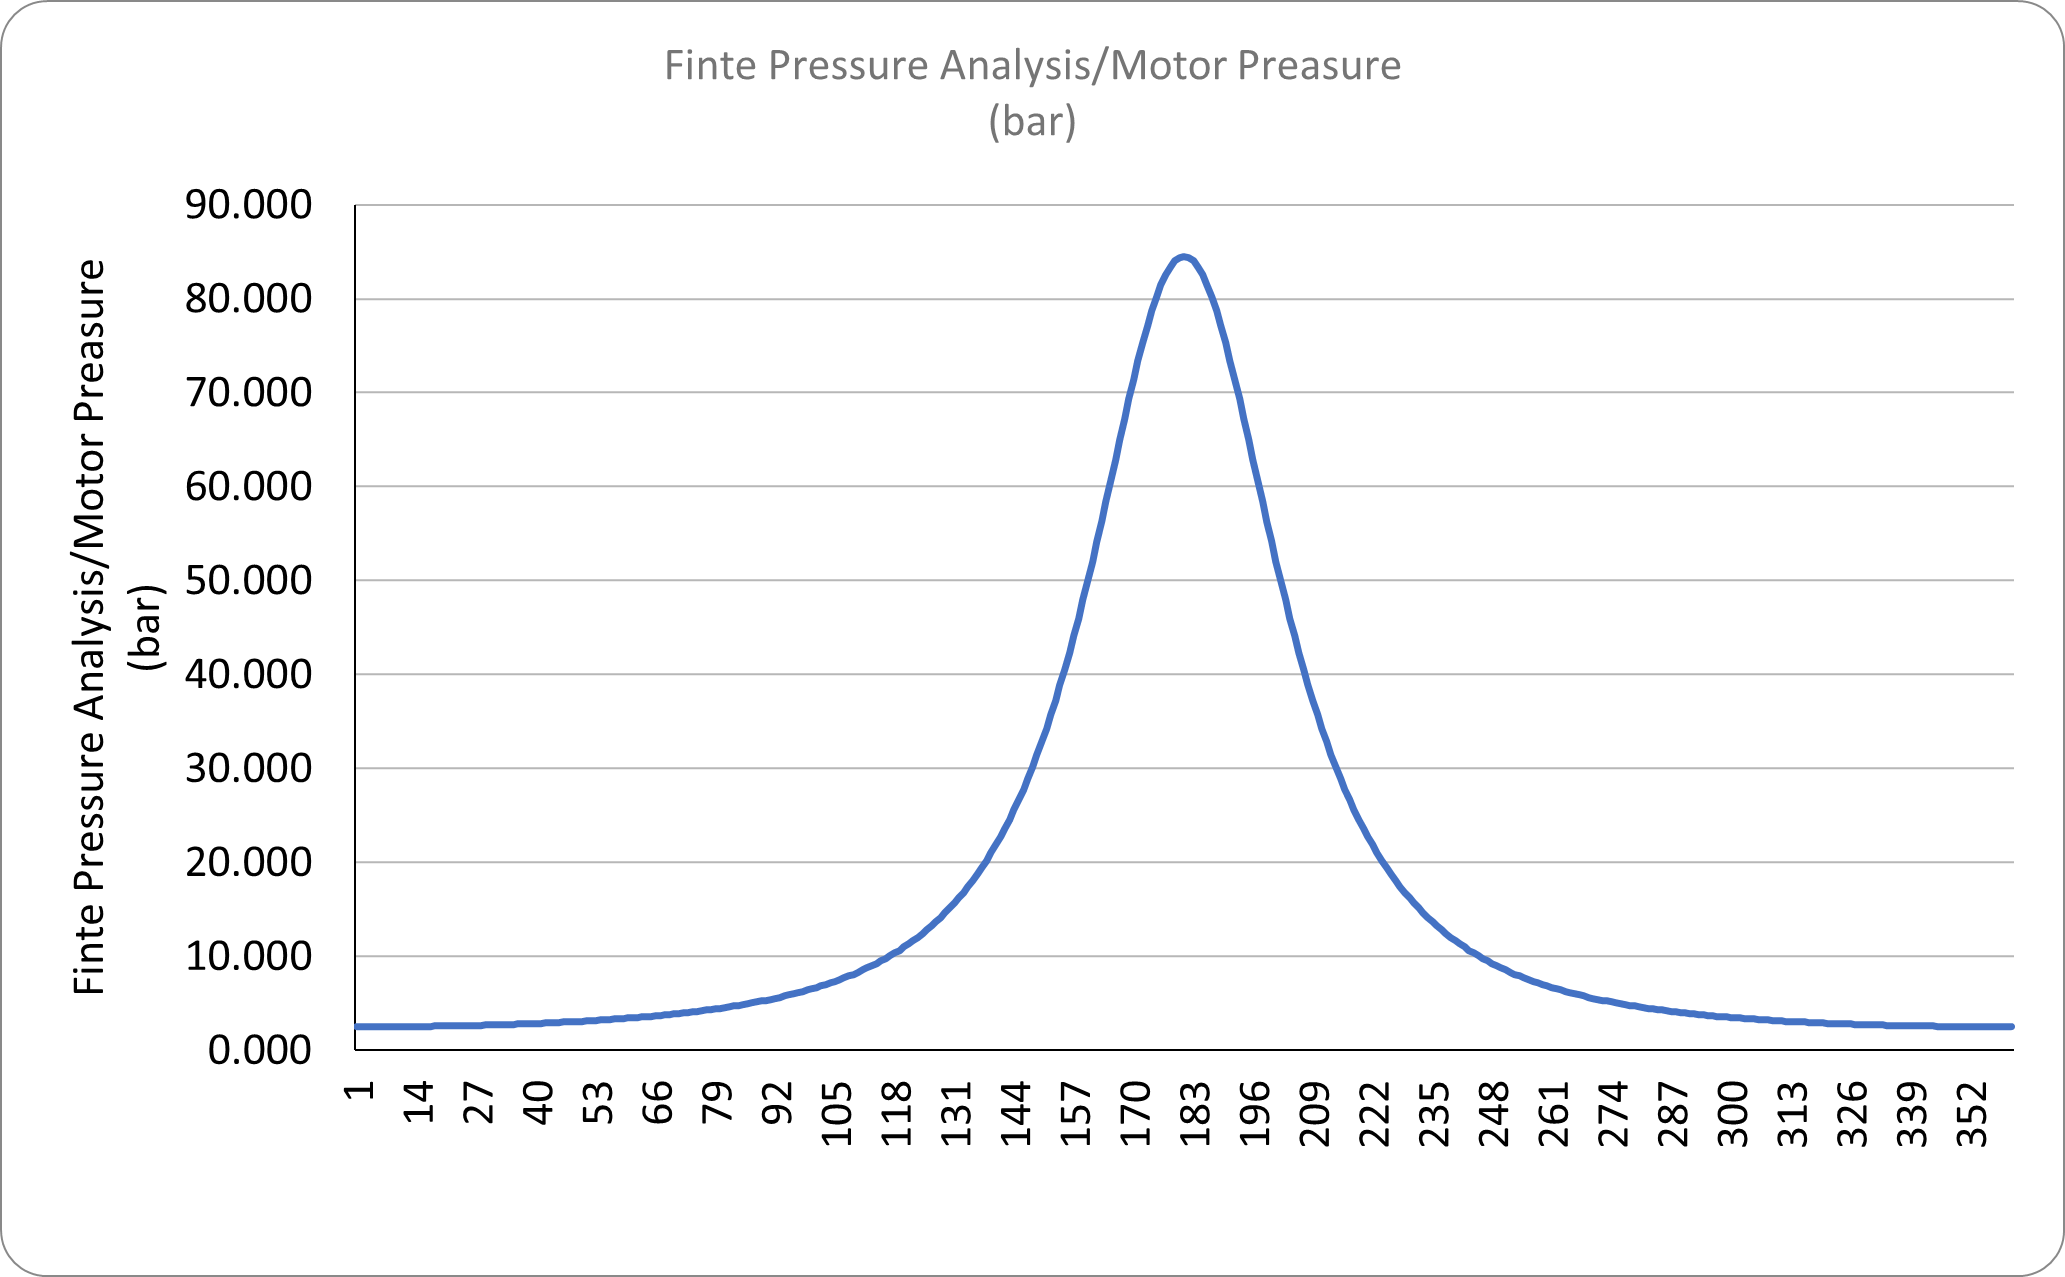
The basics of the table was to take the Crank Angle then solve for Finite Volume which enabled us to solve for Analytical Pressure and Finite Pressure. This coupled with the Wiebe Function and Rate of Heat Release we were able to solve for the cylinder Pressure with Heat Release and then solve for the Work from the engine.
Fuel Chemistry
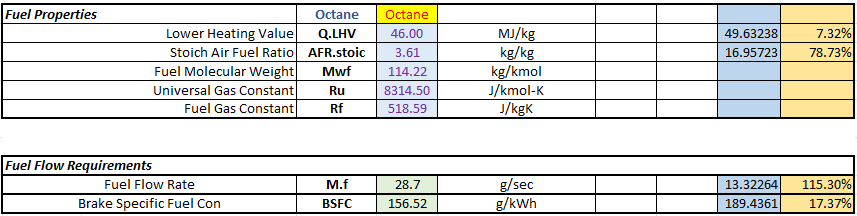
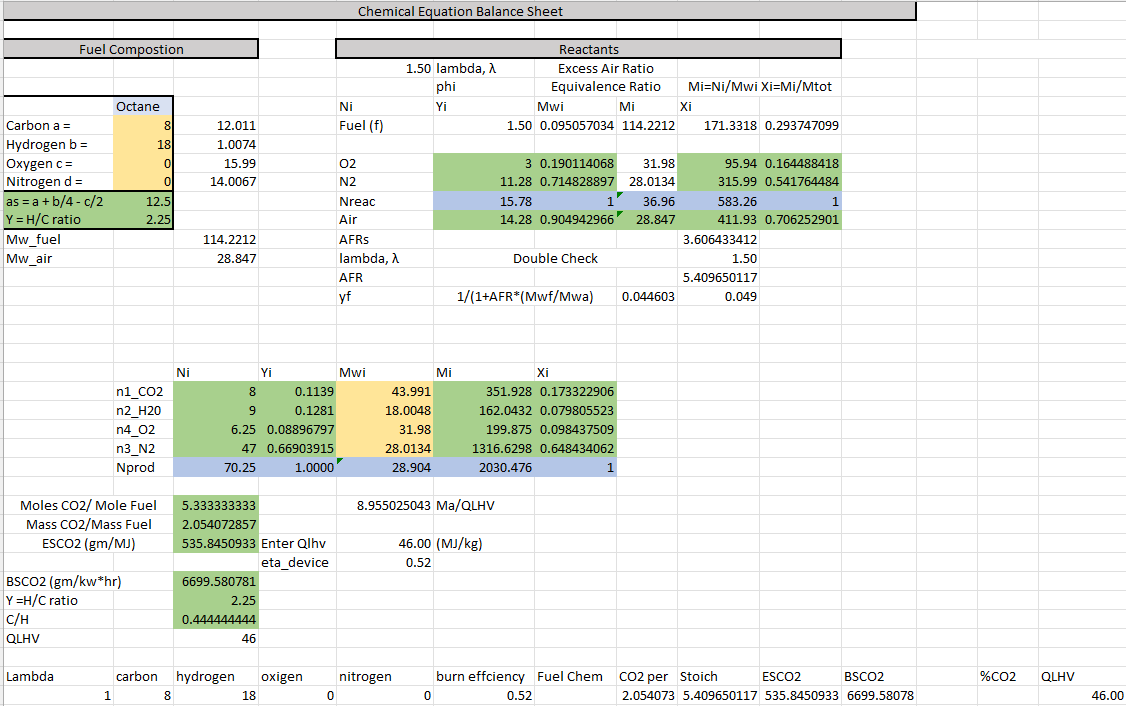
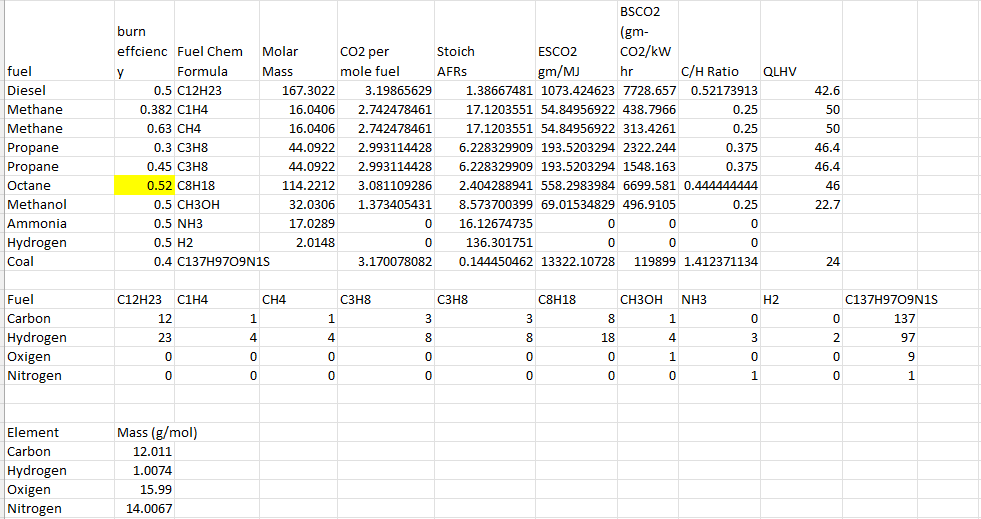
Knowing the geometry and type of fuel that was used in the engine we then were able to calculate out all needed values of the fuel properties. In this set up we used Octane which we found had a lower heating value of 46 MJ/kg. Our chemistry sheet would calulate out the number of atom for carbon, hydrogen, oxygen, and nitrogen. From this and the sheet would calculate the stoichiometric equation for fuel and air ratio then also give Engine Specific CO2 as well as Brake Specific CO2. There were some needed values to be input to be able to get these numbers like burn efficiency of the fuel which we entered as .52. This number came from research finding the implementation of a combustion pre chamber can get approximately 50% burn efficiency due to its ability to increase burn speed from sending flame jets into the cylinder instead of a small spark to ignite the entire chambers fuel content.
Air and Fuel Requirements
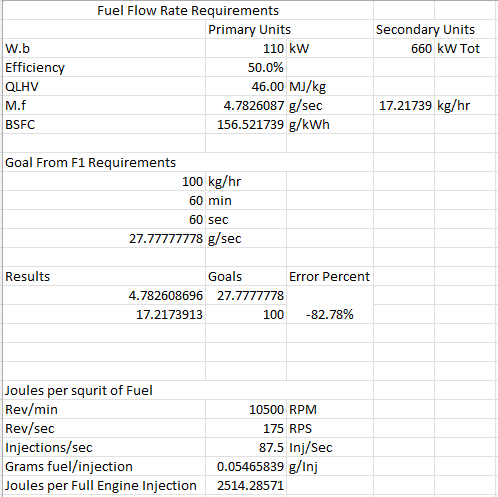
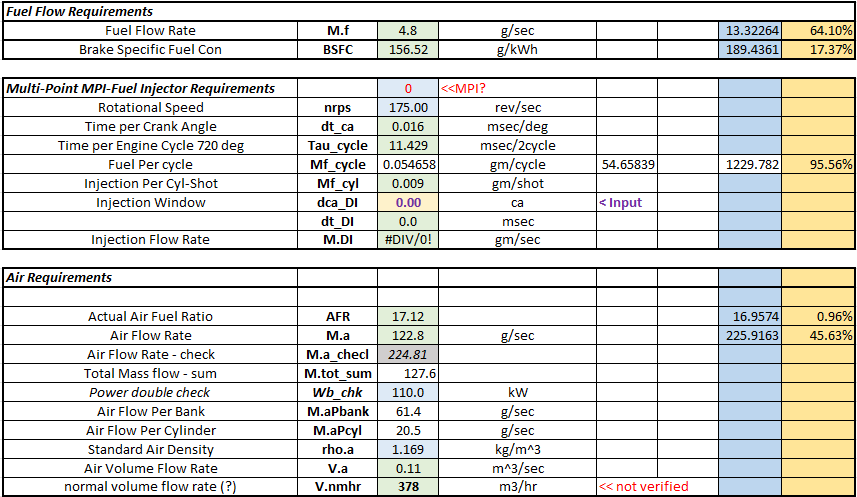
Given the stoichiometric values for air to fuel ratio we then took these values and the know fuel flow FIA F1 maximum fuel flow regulations of 100 kg/hr and calculate the needed fuel shot per cycle. This was was the assumption that max power was made at 10,500 RPM based on when driver usually shift. These values were then able to calculate the need air flow. From what I understand, the power output of Formula 1 cars from this generation is regulated by the amount of fuel flow that can be used. This differs from a series like NASCAR which has regulations on air flow with the use of an air restrictor. Either way it limits a key component of the combustion process. In this case with the fuel being the limiting factor, the engine uses turbos to get the required air needed to get to lamba 1 for combustion for maximum power output from the given fuel shot per cycle. This is how we were able to get the air requirements for the engine given the fuel rate.
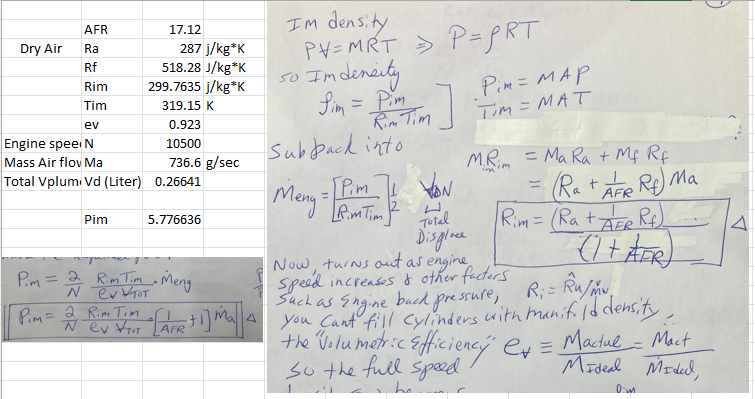
The air flow required for combustion is needed for the Wiebe function. This will give the amount of air, and therefore the volume and pressure of the that is going into the cylinder during the intake stroke.
Thermodynamic Properties of Cylinder
Motivation
To complete the feasibility of the engine we had to calculate the cylinder pressure during combustion. We took the claimed thermodynamic efficiency of the engine to be 50%, then took the geometry and fueling parameters for the engine, then finally the estimated power output. But none of these inputs deal with what stresses the engine components would experience, so this why we had to look at the cylinder pressure required to be able to get these outputs. The engine efficiency has direct correlation to the compression ratio but the high the compression ratio the higher the pressure would be inside the cylinder, so the limiting factor would be the engines ability to be reliable pushing very high internal pressures.
Analysis
With all of the parameters of the engine now in place and the ability to change the timing the combustion event we were able to optimize the system. The four main levers that we used to optimize efficiency were the completeness of burn, aggressiveness of burn or how fast it burns, then spark timing, and duration of combustion We found in order to achieve the claimed 50% efficiency that the combustion event would have to happen right before top dead center and have a very short heat release duration. The issue with this is that the cylinder pressure becomes very high. There are ways to decrease cylinder pressure to a more realistic value, however that directly correlates to motor efficiency.
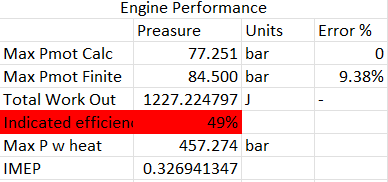
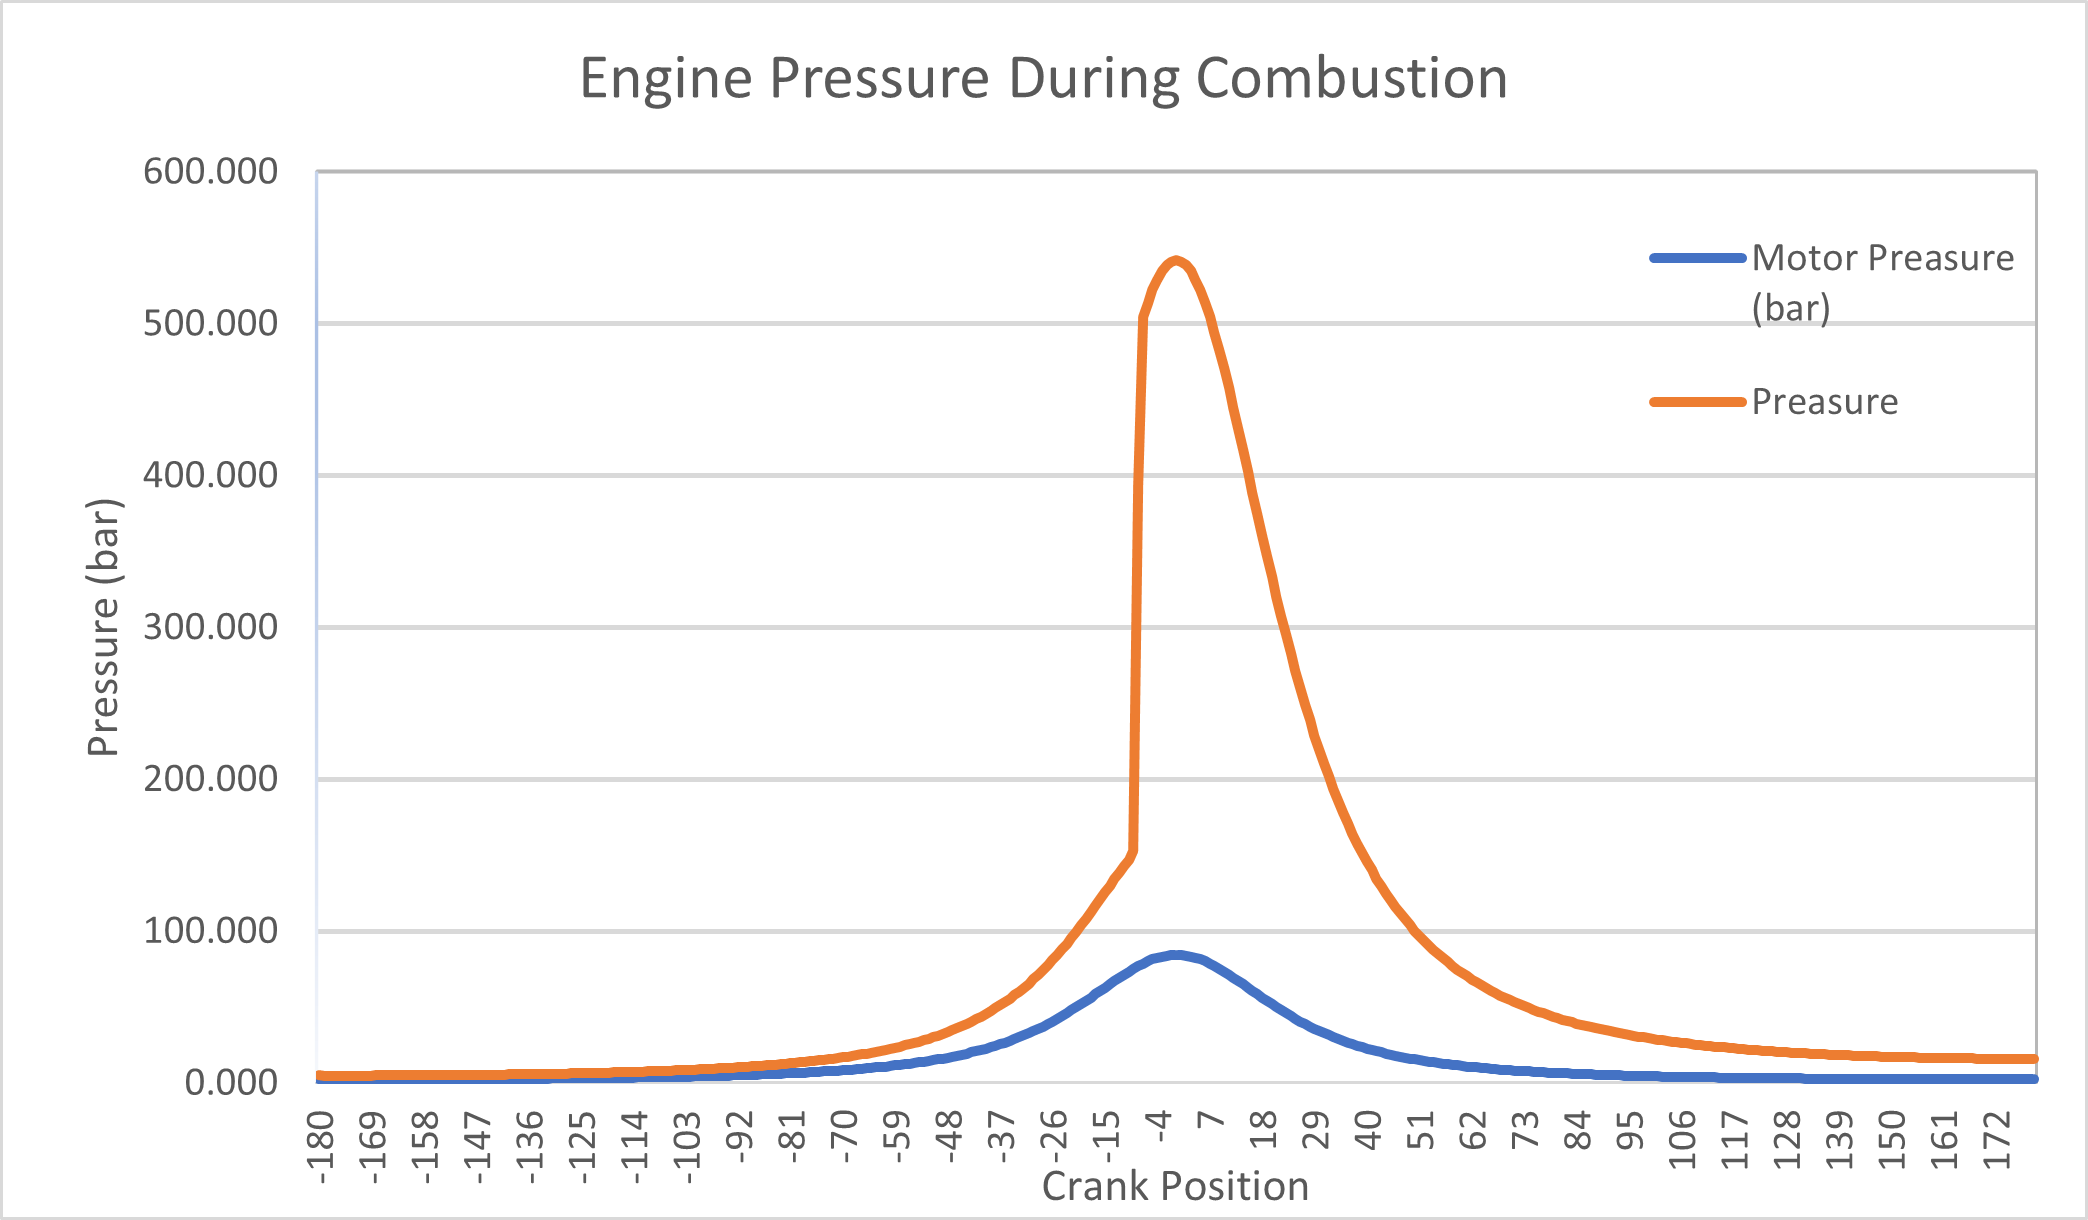
Final Results
Given all the parameters and controlling the heat release of the combustion event we were able to see 50% thermal efficiency. However the cylinder pressures required to do so were so astronomically improbable that we were unable to fully get the engine to operate at 50% with staying under 250 bar of cylinder pressure. Our max cylinder pressure with this result was over 500 bar. With lengthening the combustion even say changing the start to -10 degrees before top dead center and having the event end at 15 degrees after top dead center we were able to get the pressures under control however thermodynamic efficiency was only 35%.
In the end we were able to build a fully functional RFD tool that given engine parameters would give the calculated engine efficiency and the pressure traces of the engine throughout the cycle. We were not able to fully get the claimed 50% thermal efficiency while staying under 250 bar of pressure however, if we were I would imagine I would be approached by Mercedes themselves.
The biggest take away from this project was the ability to build this tool and take publicly available information and get see what changes to the engine parameters can do to the power able to be produced as well as the effect those changes make on the cylinder pressures seen. This project gave great insight into how each parameter of the engine and changing it will effect different outputs of the engine.